
Incremental Optimization in Apache Flink ... with AI

While performance always matters, streaming pipelines are where it can matter a lot. Concepts like Big O notation that you may have repressed from your days learning computer science can come back to bite you if neglected (I’m looking at you, quadruply nested loops). Often, the most minimal of changes can drastically impact the performance and efficiency of your data pipelines — but how do you even know where to look?
Classic observability tactics like metrics can often paint a picture, and taking advantage of Apache Flink’s built-in profiler can provide even deeper insights into the code being executed. How could we create a feedback loop to incrementally optimize our pipeline?
You guessed it, let’s use AI.
You Don't Know What You Don't Know
tl;dr: You can probably skip this section if you already know about Apache Flink’s built-in metrics and profiler.
Without instantly handing this post over to our AI overlords, it’s important to understand how to troubleshoot Apache Flink jobs in the first place. A job can be running perfectly one minute and suddenly grind to a halt – especially when the scale shifts dramatically. These moments can leave you scratching your head and feeling like our friend Brad Pitt here, just wondering…

As mentioned earlier in the intro to this post, two extremely useful tools for troubleshooting performance issues — to help you figure out what’s going on within that black box of streaming magic — are Apache Flink’s built-in observability metrics and the profiler.
Observability Metrics
tl;dr: Use Flink’s built-in metrics for monitoring internal metrics and custom metrics — and please use them for alerting.
Apache Flink already publishes a ton of available metrics on just about every characteristic you could care about for a running job: resource metrics, JVM-specific metrics, network buffers, checkpointing — you name it, it’s probably there. Leveraging tools like Prometheus and Grafana along with Flink’s built-in metrics can provide you with a rich, exploratory experience to troubleshoot performance.
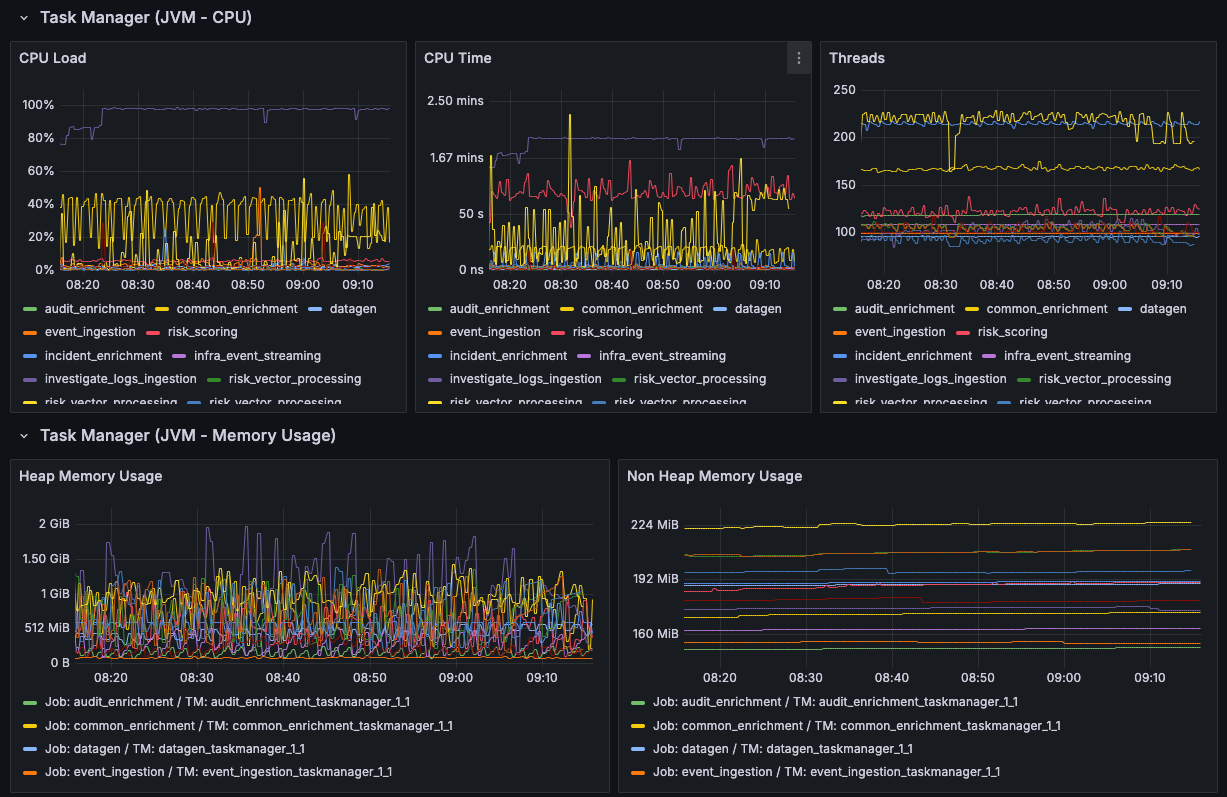
These metrics can be crucial in painting a picture of the overall health of the job at a high level. A well-crafted dashboard can allow you to easily identify a performance bottleneck — especially after a new deployment — or correlate odd behavior with another event.
It’s extremely important to take advantage of these, along with introducing your own custom metrics to monitor behavior specific to your use cases. It’s even more important to tie these metrics into your alerting systems so you’re aware when something bad is happening — or about to happen (via linear regression metrics).
Apache Flink Profiler
tl;dr: The built-in profiler can help you identify bottlenecks, hot paths, and isolate where improvements can be made.
Since the 1.19 release, Apache Flink jobs come packaged with a built-in profiler that can be a godsend when trying to identify performance issues within running jobs. The profiler is disabled by default but can quickly be enabled through a simple configuration setting on the job:
rest.profiling.enabled: true After setting this, you can run a variety of profiler configurations to examine different aspects of your job (e.g., ITIMER, CPU, etc.) directly through the Flink UI. Using a profiler can help you easily isolate where your jobs are spending their time — and hopefully, it’s time well spent.
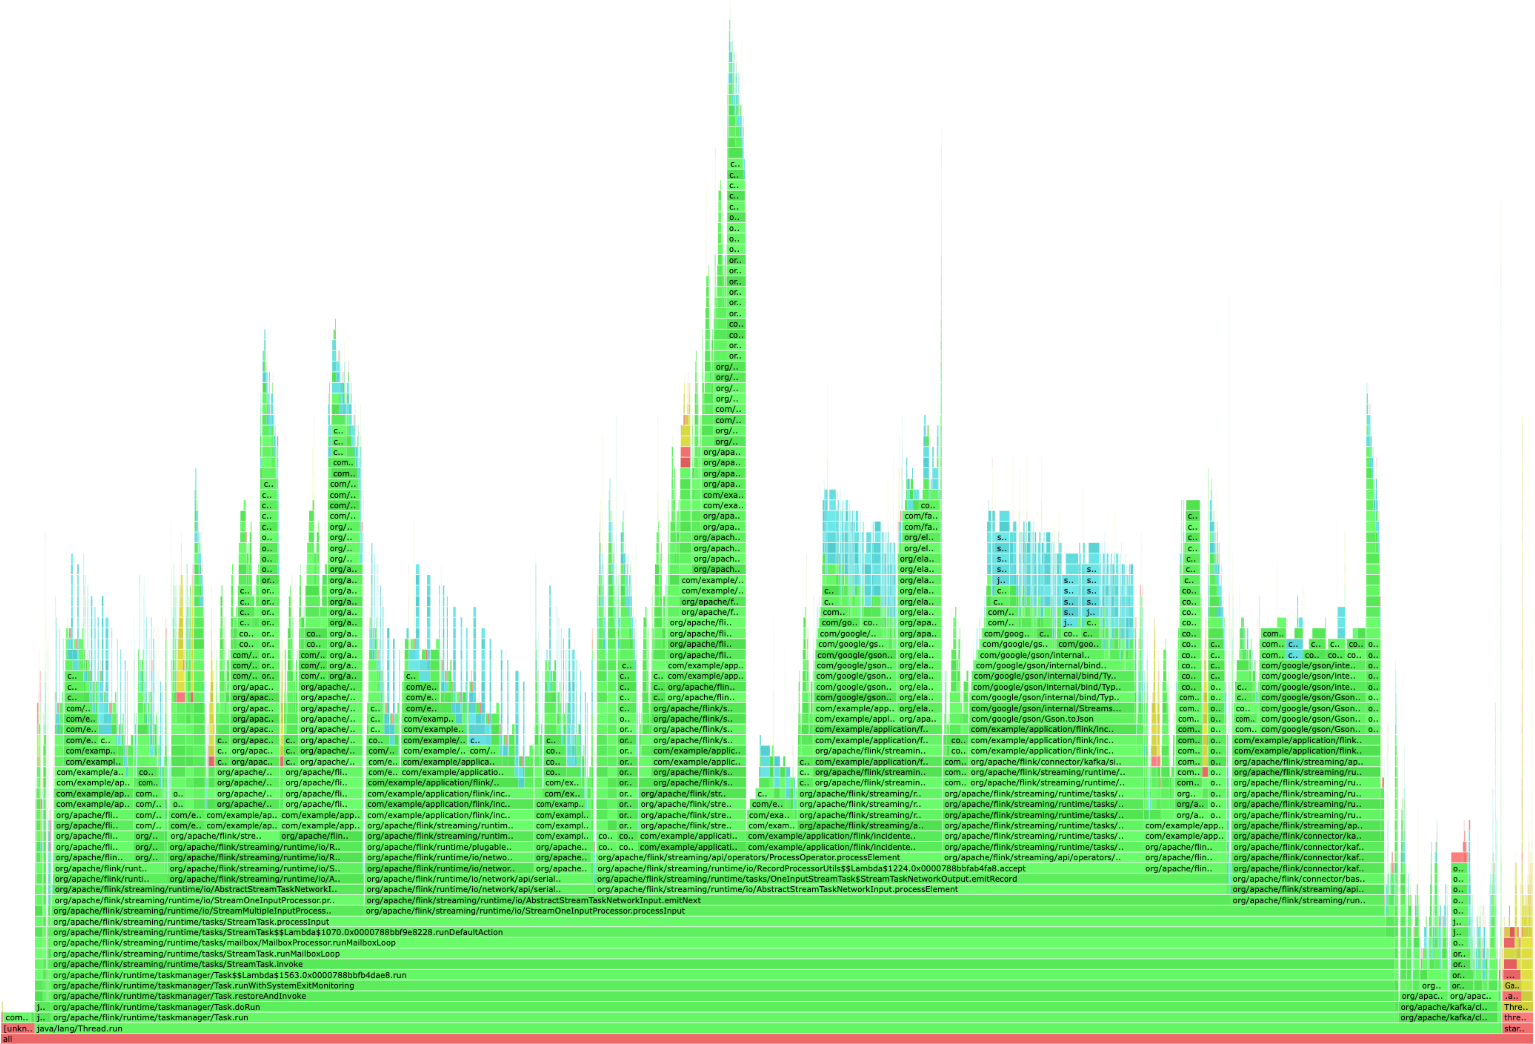
While this profiler output isn’t always the most fun to read, it can be a lifesaver in identifying exactly what’s taking up so much of your time. In the next section, we’ll see how we can leverage something that’s quite good at consuming text to put all of this together.
Before Improving, Measure You Must
tl;dr: Measure, measure, measure.
Before we do anything with AI, we need to measure. Measurement is what allows us to identify improvement. It can look different for each job (e.g., throughput, latency, etc.), but you need to make sure you have a solid baseline to compare against.
The Circle of Life Agentic Agent Feedback
tl;dr: Okay, now let’s use the profiler as a starting point for incremental improvement, along with agentic AI, to identify bottlenecks in a powerful feedback loop.
Now that we have the tools to identify potential problems or areas of improvement for the job, how can we go about fixing them? Yes — it’s finally here. This is the part of the post where we’re going to talk about leveraging AI.
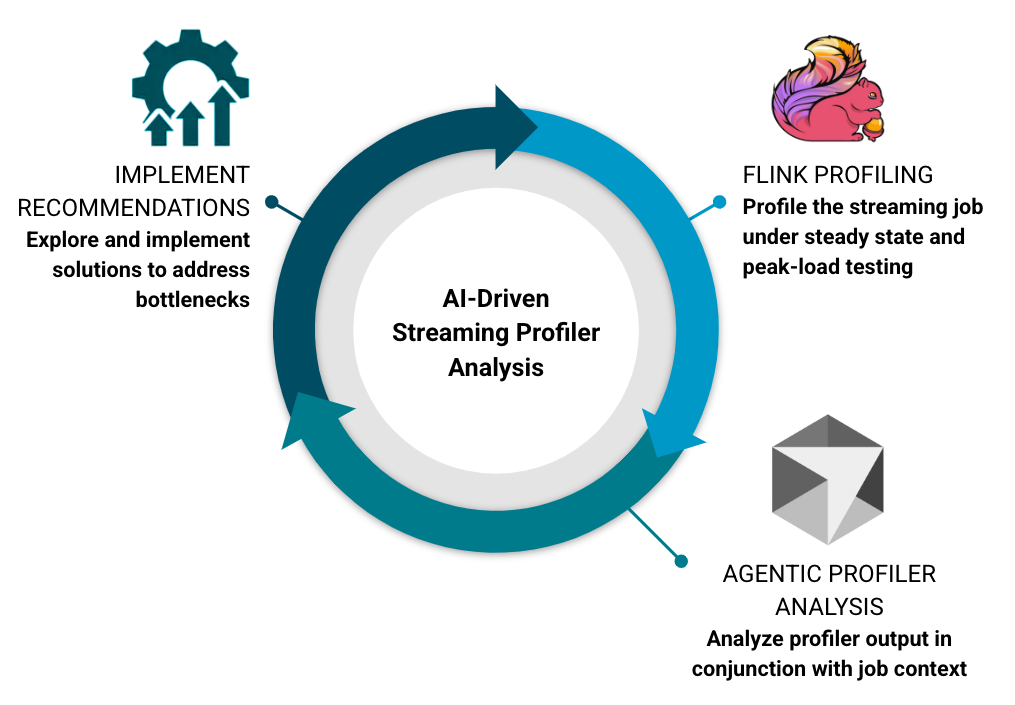
Let’s talk about creating a feedback loop to implement these improvements. It will consist of a three-step process that can be done against a live job or one running in isolation (e.g., during performance testing):
- Profiling – Use the Apache Flink profiler to examine the performance of the job and generate various reports (consider targeting all the major profiler families).
- Analysis – Leverage an AI agent with context about the job in question and prompt it to identify hot paths, bottlenecks, and areas of improvement. Context is crucial here, as the agent needs to accurately correlate profiler output with the code being executed.
- Improvement – Evaluate and rank the recommended improvements, then repeat the cycle.
(Bonus: Measure again. Having a repeatable test to accurately measure improvements is important.)
Repeating this process can yield incredible results — especially if you aren’t aware of what the actual bottlenecks are.
What Does Analysis Look Like?
tl;dr: “Let AI do it” isn’t exactly clear — so how do we actually tell AI to make things better?
Let’s talk about how to present this to your AI agent of choice. I’ll go through the process I used, but obviously your mileage may vary.
Gather Your Measurements
At this point, you should have all your artifacts in place, including the following:
- Baseline measurements of your job (e.g., throughput, latency — whatever’s important to you).
- Bonus points for an isolated, repeatable method of getting these measurements.
- One or more profiler runs of the job (preferably under varied load).
- Some AI or AI agent du jour.
Configuring Your AI Researcher
The flavor of AI agent / LLM / model doesn’t seem to have a substantial impact, so I’d encourage you to experiment with different options. A few considerations:
- Prompting is everything, and this isn’t an exception.
- Provide a clear, preferably role-based prompt that accurately describes the artifacts you’re providing (e.g., HTML-based flamegraphs representing X, Y, Z).
- If you have something specific you want to focus on, highlight it.
- Consider ranking the potential improvements by impact to expedite the big wins first.
- Context is crucial — it allows your agent to connect the flamegraph to the code being executed. (If you aren't using a tool that allows you the LLM access to the context, then you are responsible for providing as much as you can)
Begin Triaging
After analysis is complete, this is where you (or your agentic AI) can step into the driver’s seat and begin implementing the suggested changes. As with any major refactoring, focus on keeping the changes isolated — one objective at a time.
And don’t forget to measure afterwards.
How Did This Work For Me?
tl;dr; It worked pretty darn well
I used the above process on a legacy job that had been running for several years and had grown pretty wildly over time. The improvements made in about a week were staggering:

Following the above cycle, I improved throughput within an existing job by about 1200 % for steady-state volume and over 6000 % for peak loads — all while dramatically reducing CPU utilization.
As far as details, I'll walk through exactly what I did. It may/may not make sense in your situation, but knowledge is power.
Defining a Repeatable Scale Test (Measure / Profile)
In this case, the job was reading from a Kafka topic and writing to three separate sinks: two Kafka and one Elasticsearch. To gather my initial measurements, I created a repeatable “unit” test that would inject messages into the source topic, all while calculating durations and latencies to/from these various sources and sinks.
@Test
fun `repeatable scale test`() {
  // Various flags for test characteristics
  val iterations = ...
  val recordsPerIteration = ...

  for (iteration in 1..iterations) {
     // Define a random seed (UUID) to scope testing measurements
     val seed = ...

     // Generate payloads (pre-built to not take a latency hit)
     val payloads = Array(recordsPerIteration) { i ->
         ProducerRecord(SOURCE_TOPIC, key = "$seed-$i", message(...))
     }

     // Start measuring (to Kafka)
     val start = Instant.now()

     // Send records through
     repeat(recordsPerIteration) { i ->
        producer.send(payloads[i])
     }
     producer.flush()

     // Output time to Kafka
     val writeTimeKafka = (Instant.now().toEpochMilli() - start.toEpochMilli()) / 1000.0
     ...

     // Start measuring to Elasticsearch
     val startEs = Instant.now()
     var countEs = 0
     // Wait for all records to be indexed in Elasticsearch
     // (continually count until records == count)
     do {
         // Add a sleep/wait here to not blow up Elasticsearch

         // Query Elasticsearch (for seed)
         val countRequest = SearchRequest(INDEX_NAME).source(
             SearchSourceBuilder()
                 .query(
                     QueryBuilders.termQuery("seed", seed)
                 )
                 .size(0)
                 .trackTotalHits(true)
         )

         // Update count
         val countResponse = esClient.search(countRequest, RequestOptions.DEFAULT)
         count = countResponse.hits.totalHits?.value ?: 0L
     } while (count < recordsPerIteration)

     // Output time to Elasticsearch
     val writeTimeEs = (Instant.now().toEpochMilli() - startEs.toEpochMilli()) / 1000.0
     ...

     // Run an aggregation query to calculate min/max/avg latencies
     // to Elasticsearch
     val aggregationRequest = SearchRequest(INDEX_NAME).source(
         SearchSourceBuilder()
             .query(query)
             .aggregation(AggregationBuilders.min("min_latency"))
             .aggregation(AggregationBuilders.max("max_latency"))
             .aggregation(AggregationBuilders.avg("avg_latency"))
             .size(0)
     )

     // Output aggregations
     val aggregationResponse = esClient.search(aggregationResponse,...)
     val minLatency = aggResp.aggregations.get<Min>("min_latency").value
     val maxLatency = aggResp.aggregations.get<Max>("max_latency").value
     val avgLatency = aggResp.aggregations.get<Avg>("avg_latency").value
  }
}
These tests provided me with a repeatable way to identify:
- Overall end-to-end latency (from Kafka to Elasticsearch)
- Latency statistics (calculated via timestamps added during ingestion and indexing)
- A platform for profiling — ensuring an apples-to-apples comparison between runs.
Talking to My Agent (Prompt / Analyze)
During this process, I experimented with a few different LLMs to see which performed best. The two most prominent were Cursor (Claude 4.5 Sonnet) and ChatGPT (GPT-5), with some experiments using the Gemini CLI.
I found the most success with Cursor, likely due to its access to context about the executed code. However, ChatGPT did an excellent job based solely on the provided resources.wonderful job based solely on the resources provided leveraging a prompt similar to the following (adjust as your mileage may vary):
As an experienced Apache Flink engineer familiar with the internals of Flink and its best practices, particularly around performance optimization, please analyze the performance of our Flink job based on the provided artifacts.

CURRENT PERFORMANCE CONTEXT:
- The job currently processes [X] events per second
- Current end-to-end latency: [Y] ms
- Checkpoint duration: [Z] seconds

[Include any other relevant metrics like backpressure indicators, GC patterns, etc.]

Please review the following materials:
- The attached HTML flamegraph(s) generated by async-profiler showing execution patterns (representing ITIMER, Wall Clock, etc.)

The relevant source code for the Flink job can be found at the following location:
- @/your-directory/job

Please provide a detailed analysis with the following:

- PERFORMANCE BOTTLENECKS: Identify the most significant bottlenecks visible in the flamegraph, focusing on methods consuming disproportionate CPU time or showing problematic patterns.
- ROOT CAUSE ANALYSIS: For each identified bottleneck, determine the likely underlying cause (e.g., inefficient serialization/deserialization, excessive object creation, blocking I/O operations).
- RECOMMENDATIONS: Provide specific, actionable recommendations to address each bottleneck, ordered by potential impact.

For each recommendation:
- Describe the proposed change
- Explain how it addresses the bottleneck
- Estimate the potential performance improvement
- Note any trade-offs or considerations

ADDITIONAL OBSERVATIONS: Highlight any other performance concerns visible in the provided materials that might not be immediate bottlenecks but could become issues under different workloads or at scale.
Making Improvements (Analyze / Improve)
The feedback was incredible and varied depending on the model. In many cases, it quickly identified huge performance issues (typically related to configuration and serialization) within seconds:
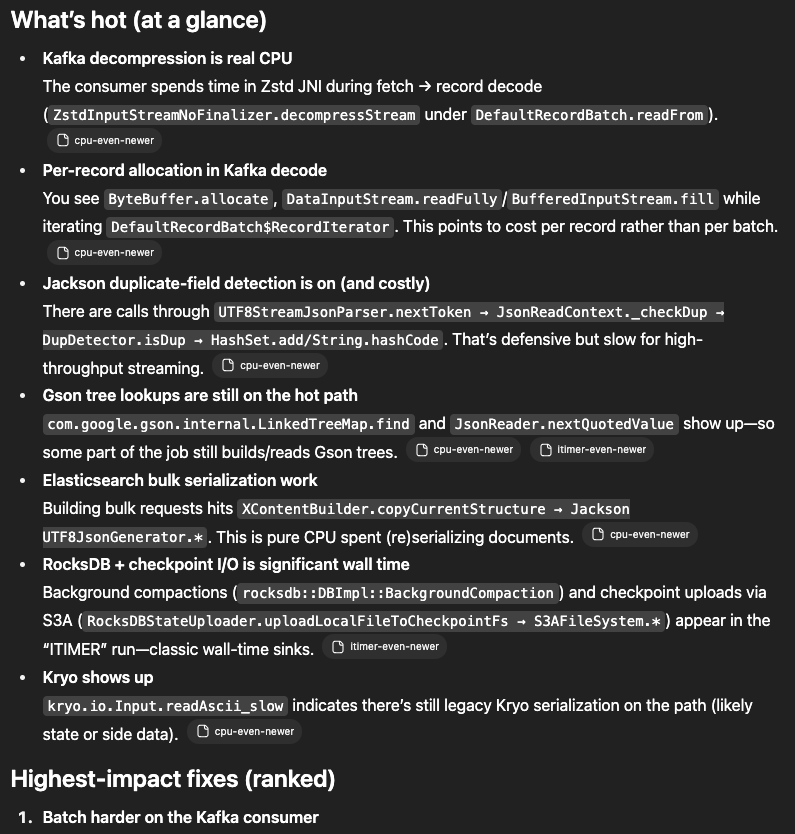
These could then be triaged in order of impact — you can even specify the expected “rate of return” if you want to target larger efforts first.
What Changed?
In this job, there were numerous impactful changes — some configuration, some serialization — but all moving in the right direction (ratios maintained for example purposes):
| Change | Throughput | Improvement |
|---|---|---|
| (baseline) | 100.8470771 | N/A |
| Elasticsearch Batching Configuration | 161.7366539 | 60.38% |
| Introduced Custom JsonObjectSerializer | 206.80778 | 105.07% |
| JSON Related Optimizations | 280.3142191 | 177.96% |
| Internal Binary Support to Serializer | 310.2328853 | 207.63% |
| Added Explicit Typing for Operators | 639.1004829 | 533.73% |
| Rebalancing for Hot Keys / Divergence Unions | 657.9706843 | 552.44% |
| Refactored External Operator Asynchrony | 793.9557312 | 687.29% |
| Fast Uploads Configuration | 1210.0271 | 1099.86% |
| Slightly Bigger Checkpoints | 1266.025641 | 1155.39% |
What's Next?
While this was an extremely fun exercise in leveraging AI beyond the simple “write me some code” use case, it opened the door to extending this process further — especially through automation.
In a future endeavor, I plan to explore automating this process by combining a few key components or at least playing around with them:
- Kubernetes Cron Job (or equivalent) – Responsible for kicking off evaluation profiler runs and submitting them to an LLM with a predefined prompt.
- Predefined Prompt – Generic or tailored to the job’s purpose.
- Metrics Integration – Incorporating profiler results with existing metrics (e.g., CPU, checkpointing, throughput) for holistic analysis.
- LLM Integration – Removing the manual element via an API that sends the prompt and generated artifacts for analysis.
- Historical Tracking – Maintaining a record of improvements over time.
- Developer Notification – Letting engineers know when a large regression is detected and providing recommendations on improving it.